
Key Macroeconomic Indicators
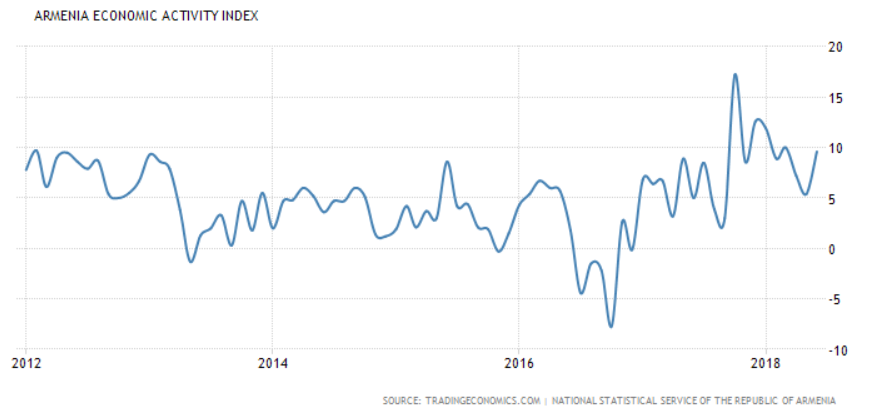
- Jun 2018 Year-on-Year Economic Activity Index: +9.6%
- Jan-Jun 2018 Year-on Year Economy Activity Index: +8.9%
- Jun 2018 Year-on-Year Exports: +6.7%
- Jan-Jun 2018 Year-on Year Exports: +20.0%
- Jun 2018 Year-on-Year Imports: +20.8%
- Jan-Jun 2018 Year-on Year Imports: +33.9%
- Jun 2018 Year-on Year Average Monthly Wages: -6.1%
- Jan-Jun 2018 Year-on Year Average Monthly Wages: +1.3%
- Jun 2018 Year-on Year Consumer Price Index: +0.9%
- Jan-Jun 2018 Year-on Year Consumer Price Index: +2.4%
Analysis
The year-on-year economic activity growth for June was registered at +9.6%, rising from +5.4% in May and +7.2% in April, which had been drops registered during the popular civil disobedience movement, following six months of double-digit average growth.
Overall, the growth rate in the first half of the year averaged an impressive +8.9%, driven by a +18.1% growth in services, a +13.5% growth in construction, a +9.1% growth in trade, a +5.5% growth in agriculture, and a +3.7% growth in industrial output. Over the first six months of the year all five categories of the economy have registered positive growth.
The surge in growth rate in June was primarily driven by agriculture, which registered a +14.0% monthly year-on-year growth rate thanks to favorable weather conditions, and a +21.2% monthly year-on-year growth rate registered in the services sector.
One very significant and surprising negative point on the monthly macroeconomic report was a -6.1% decline in year-on-year monthly wages for the month of June.
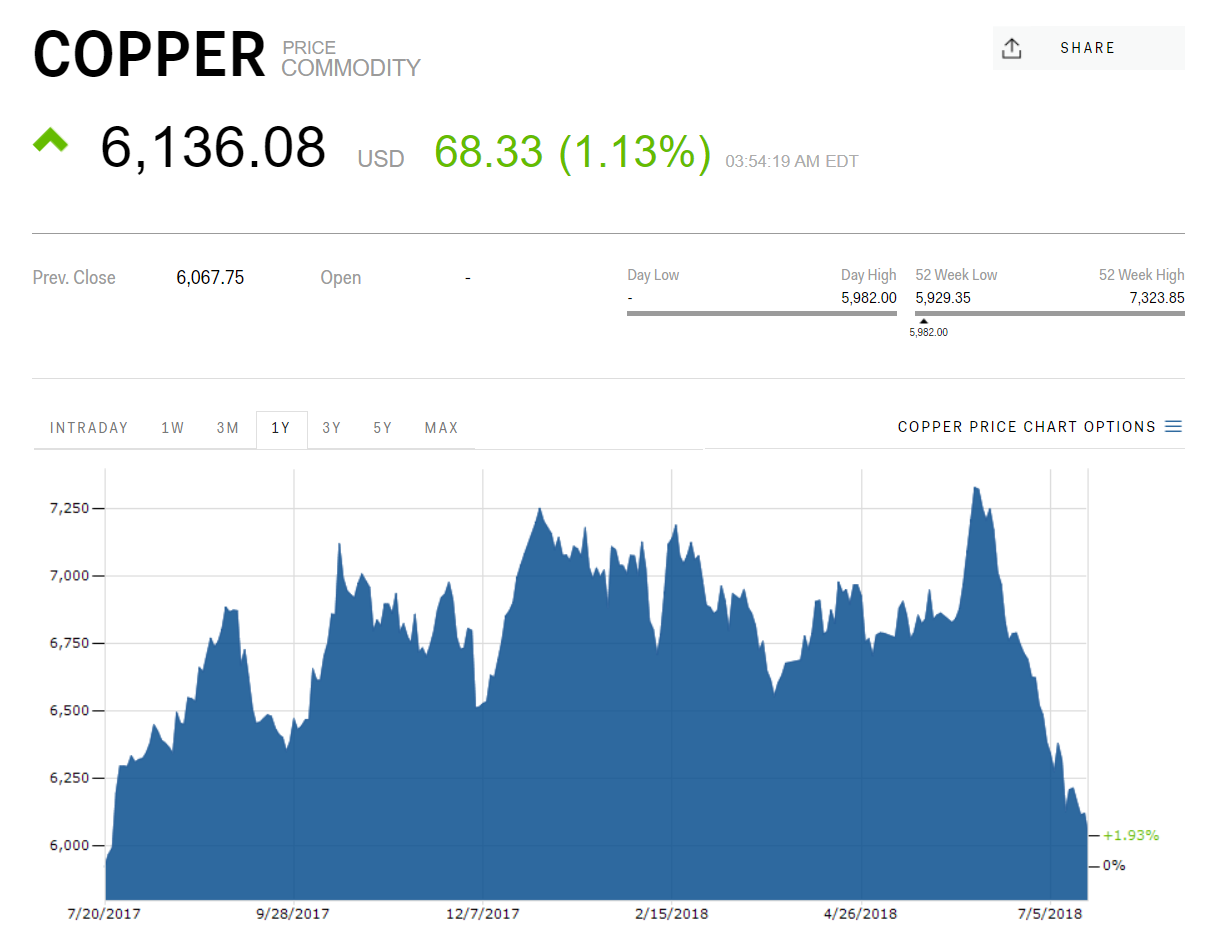
Exports for June registered a 6.7% year-on-year growth, while over the first six months that figure stood at 20.0%. Exports averaged a 34.4% growth rate over the first quarter, before being adversely affected by the popular civil disobedience movement that would follow, dropping to +9.8% in April, before rebounding to 20.6% in May, and then falling again in June.
The latest fall in exports is likely heavily influenced by the drop in value of copper, by far Armenia’s largest and most important export. After hitting a four year high, prices have been falling for the past five weeks. The price is now at a one year low.
In 2017 overall exports equaled 2.243 billion USD, surpassing the two billion dollar mark for the first time since independence. Exports per GDP stood at 19% at the end of 2017, a marked improvement over a decade before, when the same figure stood at 9%.
Over the first six months, the trade deficit stood at -98%, which, while being a regression from the -86% recorded for 2017, is still a marked improvement from the same figure a decade ago, which stood in the -200% to -300% range.
Russia continues to remain Armenia’s largest trade partner, with a surge in Armenian exports to Russia since Armenia’s ascent into the Eurasian Economic Union (EEU).
The improving macroeconomic situation in Russia is the most significant factor in the impressive economic growth rate in Armenia.
Imports and domestic consumption overall were boosted partially due to rising remittance from Russia, which continue to increase for the second year in a row following three years of dramatic decline due to the struggling Russian economy.
Fitch, in its latest update released on June 18th, projects a 4.7% growth rate for Armenia in 2018, while the World Bank, in its update which was released on June 6th, projects a 4.1% growth rate. Those projections are likely to be revised upward, given the latest economic numbers.
Be First to Comment